
Outlook
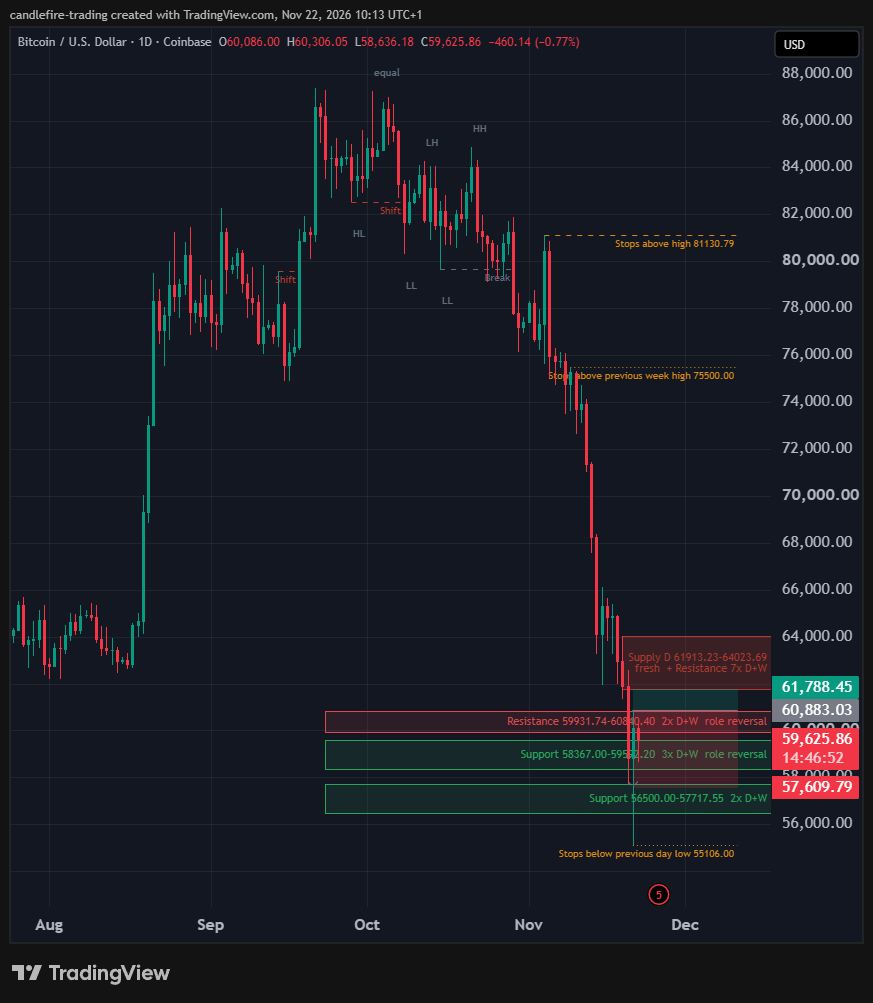
Bitcoin (BTC/USD) trades at 59,625.85 (latest price, 22 Nov 2026). Trend: weekly sideways, daily sideways, 4-hour down. The price sits in the bottom part of the weekly range (low 57,717.55, high 87,397.00). Verdict: wait.
Chartcheck
- Trend: Weekly sideways, daily sideways; both agree.
- Nearest support: 58,367.00-59,592.20, 3 reversal points on the daily and weekly chart, role reversal.
- Nearest resistance: 59,931.74-60,840.40, 2 reversal points on the daily and weekly chart, role reversal.
- Volume: 2,905 BTC on the last daily candle against a 20-day average of 11,671. That is lower.
- What I watch: A daily close below 58,367.00 breaks the nearest support zone. A daily close above 60,840.40 breaks the nearest resistance zone.
Timeframes
- Weekly: Sideways. Highs 82,814.23 (4 May, lower high), 87,397.00 (21 Sep, higher high); lows 60,001.00 (2 Feb, lower low), 57,717.55 (29 Jun, lower low).
- Daily: Sideways. Highs 84,261.99 (12 Oct, lower high), 84,856.07 (21 Oct, higher high); lows 80,314.70 (8 Oct, lower low), 79,676.02 (15 Oct, lower low).
- 4 hours: Down. Highs 64,023.69 (19 Nov, lower high), 60,883.03 (21 Nov, lower high); lows 62,000.00 (18 Nov, lower low), 55,106.00 (21 Nov, lower low).
Structure
Latest structure events: shift up through 79,591.17 on 18 Sep; shift down through 82,510.37 on 8 Oct; break down through 79,676.02 on 29 Oct. A shift is the first sign against the trend; none of the latest events is one.
Zones
- Resistance 59,931.74-60,840.40: 2 reversal points on the daily and weekly chart, role reversal.
- Resistance 61,788.45-63,019.60: 7 reversal points on the daily and weekly chart, role reversal.
- Support 58,367.00-59,592.20: 3 reversal points on the daily and weekly chart, role reversal.
- Support 56,500.00-57,717.55: 2 reversal points on the daily and weekly chart.
- Demand zone (weekly) 50,513.01-52,153.63: rally-base-rally, tested once.
- Supply zone (daily) 61,913.23-64,023.69: drop-base-drop, fresh.
Liquidity and gaps
Stops rest above the high at 81,130.79. Levels: previous day high 60,883.03, previous day low 55,106.00, previous week high 75,500.00, previous week low 61,946.17 (taken). No false breakout. No open gaps. No trend line that meets the rules (three touches, no wick through the line).
Verdict: Wait
Wait. No trade for now: weekly and daily are both sideways, so there is no trend direction to trade with. The idea being watched is a long (range trade).
Reasons
- Support, daily and weekly (3 reversal points)
- Role reversal
Trade idea
- Idea watched: long, entry 60,883.03 (at the 4-hour trigger), stop 57,609.79, target 61,788.45 (daily and weekly resistance); second target 61,913.23 (daily supply zone), risk/reward 0.28
- Condition: it becomes a trade if weekly and daily show a trend in the same direction.
Counterarguments
- Risk/reward of 0.28 is thin for the stop that is needed.
- The price has moved -22.23% over the last 20 trading days, so it is stretched and a pullback may not reach the entry.
Invalid if
A daily close below 57,609.79.
This analysis is for education and information only. It is not investment advice and not a recommendation to buy or sell. Trading leveraged products such as CFDs and volatile assets such as crypto carries a high risk of loss. You place any order yourself and carry the risk. See the Legal Notice.