
Outlook
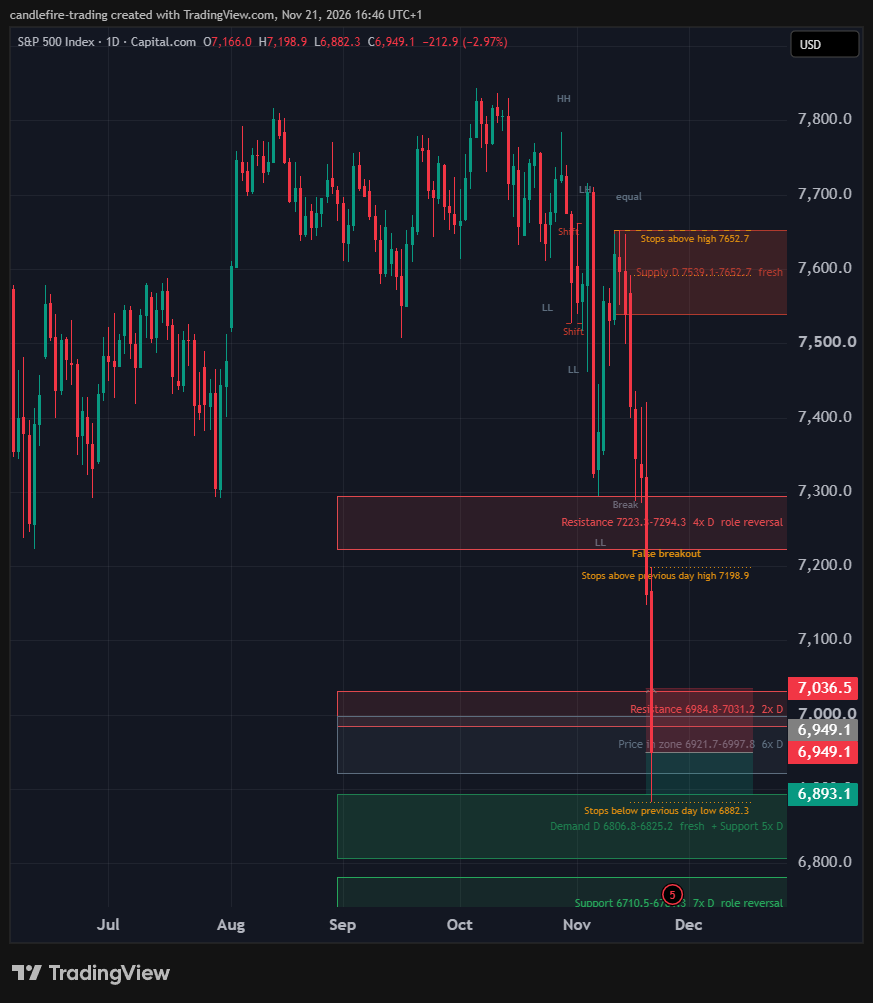
S&P 500 trades at 6,949.1 (daily close, 20 Nov 2026). Trend: weekly down, daily sideways, 4-hour sideways. The price sits in the bottom part of the weekly range (low 6,949.1, high 7,652.7). Verdict: wait.
Chartcheck
- Trend: Weekly down, daily sideways; they do not agree.
- Nearest support: 6,824.1-6,893.1, 5 reversal points on the daily chart, role reversal. The price is currently inside a zone (6,921.7-6,997.8).
- Nearest resistance: 6,984.8-7,031.2, 2 reversal points on the daily chart.
- Volume: 170,451 on the last daily candle against a 20-day average of 101,778. That is higher, but the daily trend is sideways, so there is no trend to confirm.
- What I watch: A daily close below 6,824.1 breaks the nearest support zone. A daily close above 7,031.2 breaks the nearest resistance zone.
Timeframes
- Weekly: Down. Highs 7,844.1 (5 Oct, higher high), 7,652.7 (9 Nov, lower high); lows 7,506.9 (14 Sep, higher low), 7,294.3 (2 Nov, lower low).
- Daily: Sideways. Highs 7,661.8 (2 Nov, lower high), 7,652.7 (12 Nov, equal high); lows 7,527.0 (30 Oct, lower low), 7,294.3 (6 Nov, lower low).
- 4 hours: Sideways. Highs 7,414.5 (17 Nov, lower high), 7,420.7 (19 Nov, higher high); lows 7,287.9 (17 Nov, lower low), 7,285.3 (18 Nov, equal low).
Structure
Latest structure events: shift up through 7,661.8 on 4 Nov; shift down through 7,527.0 on 5 Nov; break down through 7,294.3 on 19 Nov. A shift is the first sign against the trend; none of the latest events is one.
Zones
- Resistance 6,984.8-7,031.2: 2 reversal points on the daily chart.
- Resistance 7,223.3-7,294.3: 4 reversal points on the daily chart, role reversal.
- Support 6,824.1-6,893.1: 5 reversal points on the daily chart, role reversal.
- Support 6,710.5-6,781.3: 7 reversal points on the daily chart, role reversal.
- Supply zone (daily) 7,539.1-7,652.7: rally-base-drop, fresh.
- Demand zone (daily) 6,806.8-6,825.2: rally-base-rally, fresh.
Liquidity and gaps
Stops rest above the high at 7,652.7. Levels: previous day high 7,198.9, previous day low 6,882.3, previous week high 7,592.5, previous week low 6,882.3. There is a false breakout at a low on the daily chart (wick to 7,287.9 below 7,294.3, close back above; this speaks for long). No open gaps. No trend line that meets the rules (three touches, no wick through the line).
Fundamental backdrop
Context from Yahoo Finance data as of 22 Nov 2026 (delayed by about 15 minutes). Component weights are taken from the tracking fund and differ slightly from the index. Analyst targets lag behind sharp price moves. This block describes the environment; it does not change the chart verdict.
- Index level: 6,910.4 on 20 Nov 2026; 11.9% below its 52-week high and 6.0% below its 200-day average.
- Volatility: VIX at 35.89 (+26.2% on the day).
- Valuation: trailing P/E 22.0 (tracking fund SPY as proxy for the index).
- Apple Inc (AAPL), 7.7% of SPY: analyst consensus buy (39 analysts); mean price target +0.9% from the current price; next earnings 28 Jan (estimated); short interest 1.0% of float.
- NVIDIA Corp (NVDA), 7.6% of SPY: analyst consensus strong buy (56 analysts); mean price target +94.5% from the current price; no upcoming earnings date listed yet; short interest 1.2% of float.
- Microsoft Corp (MSFT), 5.9% of SPY: analyst consensus strong buy (54 analysts); mean price target +31.3% from the current price; next earnings 27 Jan (estimated); short interest 0.8% of float.
- Amazon.com Inc (AMZN), 3.6% of SPY: analyst consensus strong buy (60 analysts); mean price target +32.3% from the current price; no upcoming earnings date listed yet; short interest 1.0% of float.
- Alphabet Inc Class A (GOOGL), 2.5% of SPY: analyst consensus strong buy (53 analysts); mean price target +49.7% from the current price; no upcoming earnings date listed yet; short interest 0.8% of float.
- Earnings watch: none of the largest weights has a listed earnings date within the next 14 days. For NVDA, AMZN, GOOGL the data source lists no upcoming date yet, so this check is incomplete.
Verdict: Wait
Wait. No trade for now: weekly and daily do not point in the same direction. The idea being watched is a short (against the trend).
Reasons
- Resistance on the daily chart (6 reversal points)
- Resistance on the daily chart (2 reversal points)
Trade idea
- Idea watched: short, entry 6,949.1 (immediate, the price is already in the zone), stop 7,036.5, target 6,893.1 (daily support); second target 6,882.3 (stops below the previous day low), risk/reward 0.64
- Condition: it becomes a trade if weekly and daily show a trend in the same direction.
Counterarguments
- Weekly and daily trend do not agree, so the higher timeframe does not back the daily move.
- The idea goes against the trend, which lowers its quality.
Invalid if
A daily close above 7,036.5.
This analysis is for education and information only. It is not investment advice and not a recommendation to buy or sell. Trading leveraged products such as CFDs and volatile assets such as crypto carries a high risk of loss. You place any order yourself and carry the risk. See the Legal Notice.